
Excel charts not updating usually means your graph is showing old values, missing new rows, ignoring formula changes, or failing to refresh after data updates.
This commonly happens because of static ranges, manual calculation settings, broken links, Pivot Chart refresh issues, or improperly structured source data.
Why are Excel charts not updating?
Common causes:
Chart linked to a fixed range
New data added outside chart range
Workbook in Manual calculation mode
Pivot Charts not refreshed
Source formulas not recalculating
Excel Table not being used
Hidden or filtered data issues
Broken external links
What is the fastest way to fix chart update issues?
Force recalculation first.
Press:
F9
For full recalculation:
Ctrl + Alt + F9
Many chart problems are simply calculation delays.
How do I check the chart source range?
Problem:
Chart only updates until row 100.
Check chart data:
Right-click chart →
Select Data
Example fixed range:
=$A$2:$A$100
If your dataset extends further:
=$A$2:$A$150
update the source range manually.
Static ranges are the biggest cause of stale charts.
How do I make Excel charts update automatically?
Use Excel Tables.
Convert data:
Ctrl + T
Then build the chart from the table.
Benefits:
Automatic expansion
Dynamic chart updates
Cleaner reporting models
Tables are the best long-term fix.
How does Manual calculation stop chart updates?
Problem:
Underlying formulas update slowly or not at all.
Check:
Formulas → Calculation Options
Set:
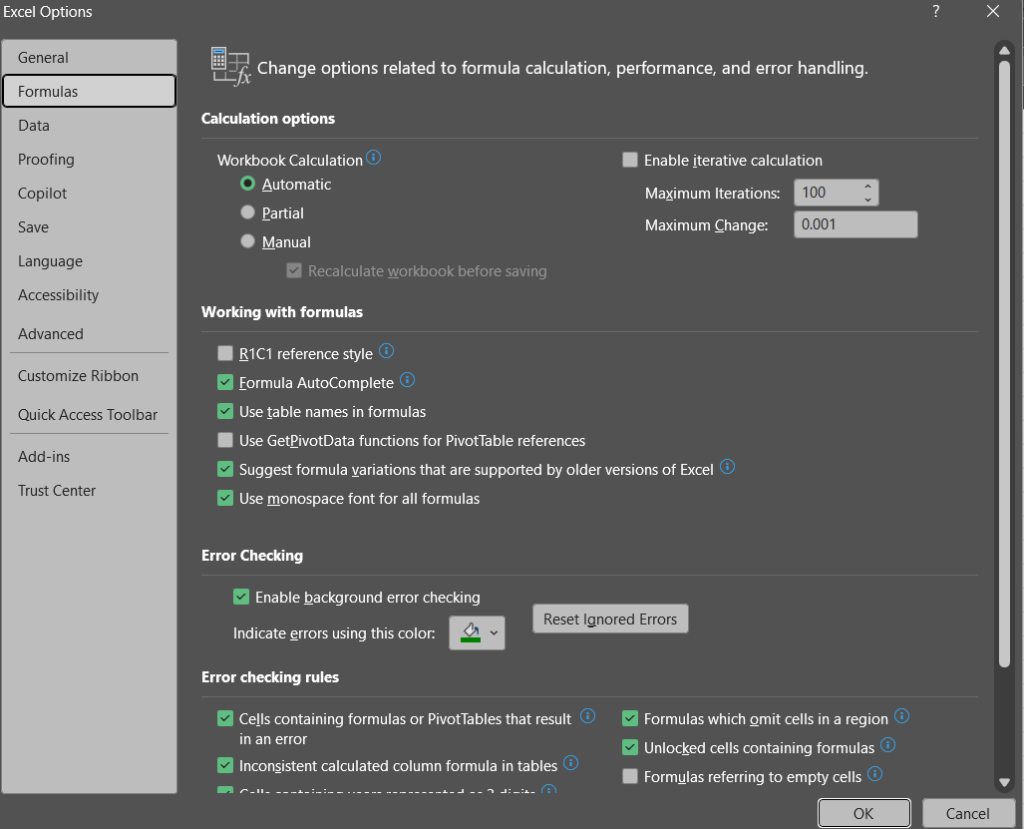
Automatic
instead of:
Manual
Charts depend on recalculated data.
Why are Pivot Charts not updating?
Pivot Charts only refresh when the Pivot Table refreshes.
Fix:
Right-click Pivot Table →
Refresh
or:
Alt + F5
For all data connections:
Ctrl + Alt + F5
How do filtered rows affect charts?
Charts may ignore hidden or filtered values.
Fix:
Click chart →
Select Data →
Hidden & Empty Cells
Enable:
Show data in hidden rows and columns
Useful for dashboards.
How do I fix charts missing new rows?
Problem:
You add new sales data but chart stops early.
Wrong:
A2:A100
Fix:
Convert to Table or extend range:
A2:A500
Better:
Dynamic named ranges or Tables.
How do external links stop charts updating?
Chart source linked to another workbook:
=[Sales.xlsx]Sheet1!A1:A100
If the source workbook moved or closed improperly:
Chart becomes stale.
Fix:
Data →
Edit Links
Update the connection.
How do formula errors stop chart updates?
Problem:
Source range contains:
#N/A
#VALUE!
#REF!
Charts may skip or distort values.
Fix formulas first.
Example:
=IFERROR(formula,0)
only if appropriate.
How do I rebuild a broken chart?
Sometimes chart references become corrupted.
Fix:
- Copy cleaned data
- Insert a new chart
- Rebuild chart references
Often faster than troubleshooting corrupted charts.
How do dynamic named ranges help charts?
Example:
=OFFSET(A1,0,0,COUNTA(A:A),1)
This expands automatically as new data appears.
Better modern option:
Excel Tables.
Why do charts stop updating after copy-paste?
Copied charts may retain old references.
Check:
Select Data
and verify ranges point to the intended sheet.
Best methods to fix chart update issues by use case
| Use Case | Best Fix |
|---|---|
| Static chart range | Expand range |
| Dynamic reporting | Excel Tables |
| Formula delays | Automatic calculation |
| Pivot Charts | Refresh Pivot Table |
| Hidden rows ignored | Show hidden data |
| Broken references | Rebuild chart |
Best practices for Excel charts
Build charts from Excel Tables
Avoid hardcoded ranges
Refresh Pivot Charts regularly
Keep formulas error-free
Use Automatic calculation mode
Audit chart ranges after copy-pasting
FAQs
Why is my Excel chart not updating?
Usually because the chart uses a fixed range or calculations are delayed.
How do I refresh a chart manually?
Press:
F9
or refresh the Pivot Table if applicable.
Why is my chart missing new data?
The source range is static and excludes new rows.
Should I use Excel Tables for charts?
Yes. Tables make charts update automatically.
Why do Pivot Charts show old data?
Because the Pivot Table itself was not refreshed.
What is the best way to create dynamic charts?
Use:
Ctrl + T
to convert source data into an Excel Table first.
Other Excel Fixes:
- Excel Circular Reference Warning? How To Fix
- Excel Formula Not Calculating? Fix It Fast
- Excel INDEX MATCH Not Working? Complete Fix Guide
- Excel XLOOKUP Not Working? Fix Errors Step-by-Step
More guides added daily.